
Monitoring & Reporting
Clear Insights and smart decisions
Full transparency within the company – for better management, informed decisions, and sustainable service excellence.


updates on a real-time basis
Transparency

utilize optimally

individual
realizable
Making
Service Quality Visible
Whether it's growth, change, or day-to-day business: if you want to lead, you need clarity. Dynamic Workload provides transparency where other systems create complexity – and enables targeted decisions based on in-depth data.


Full Transparency
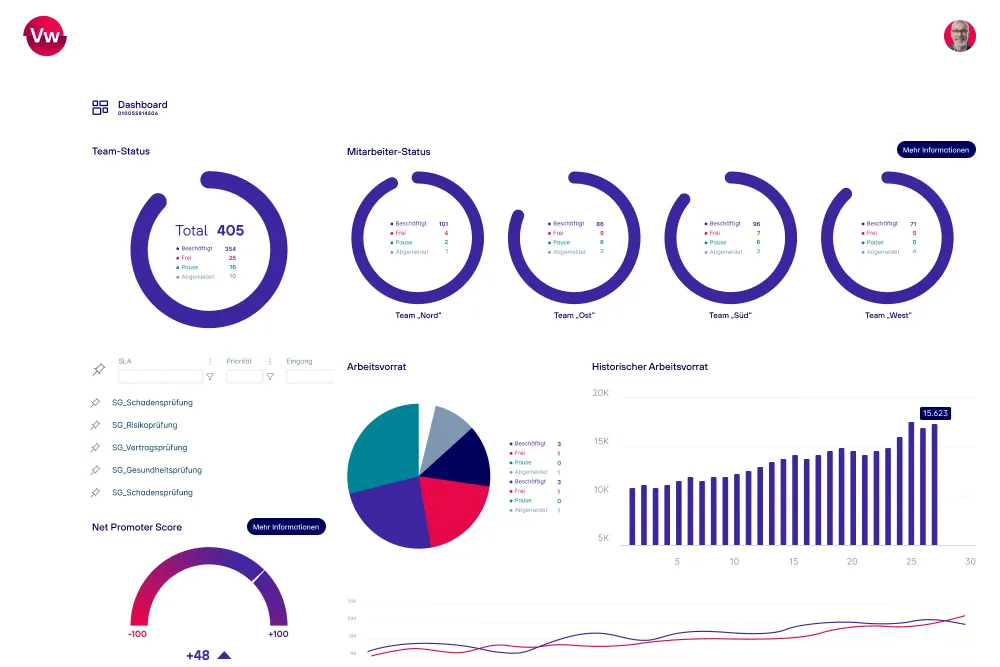
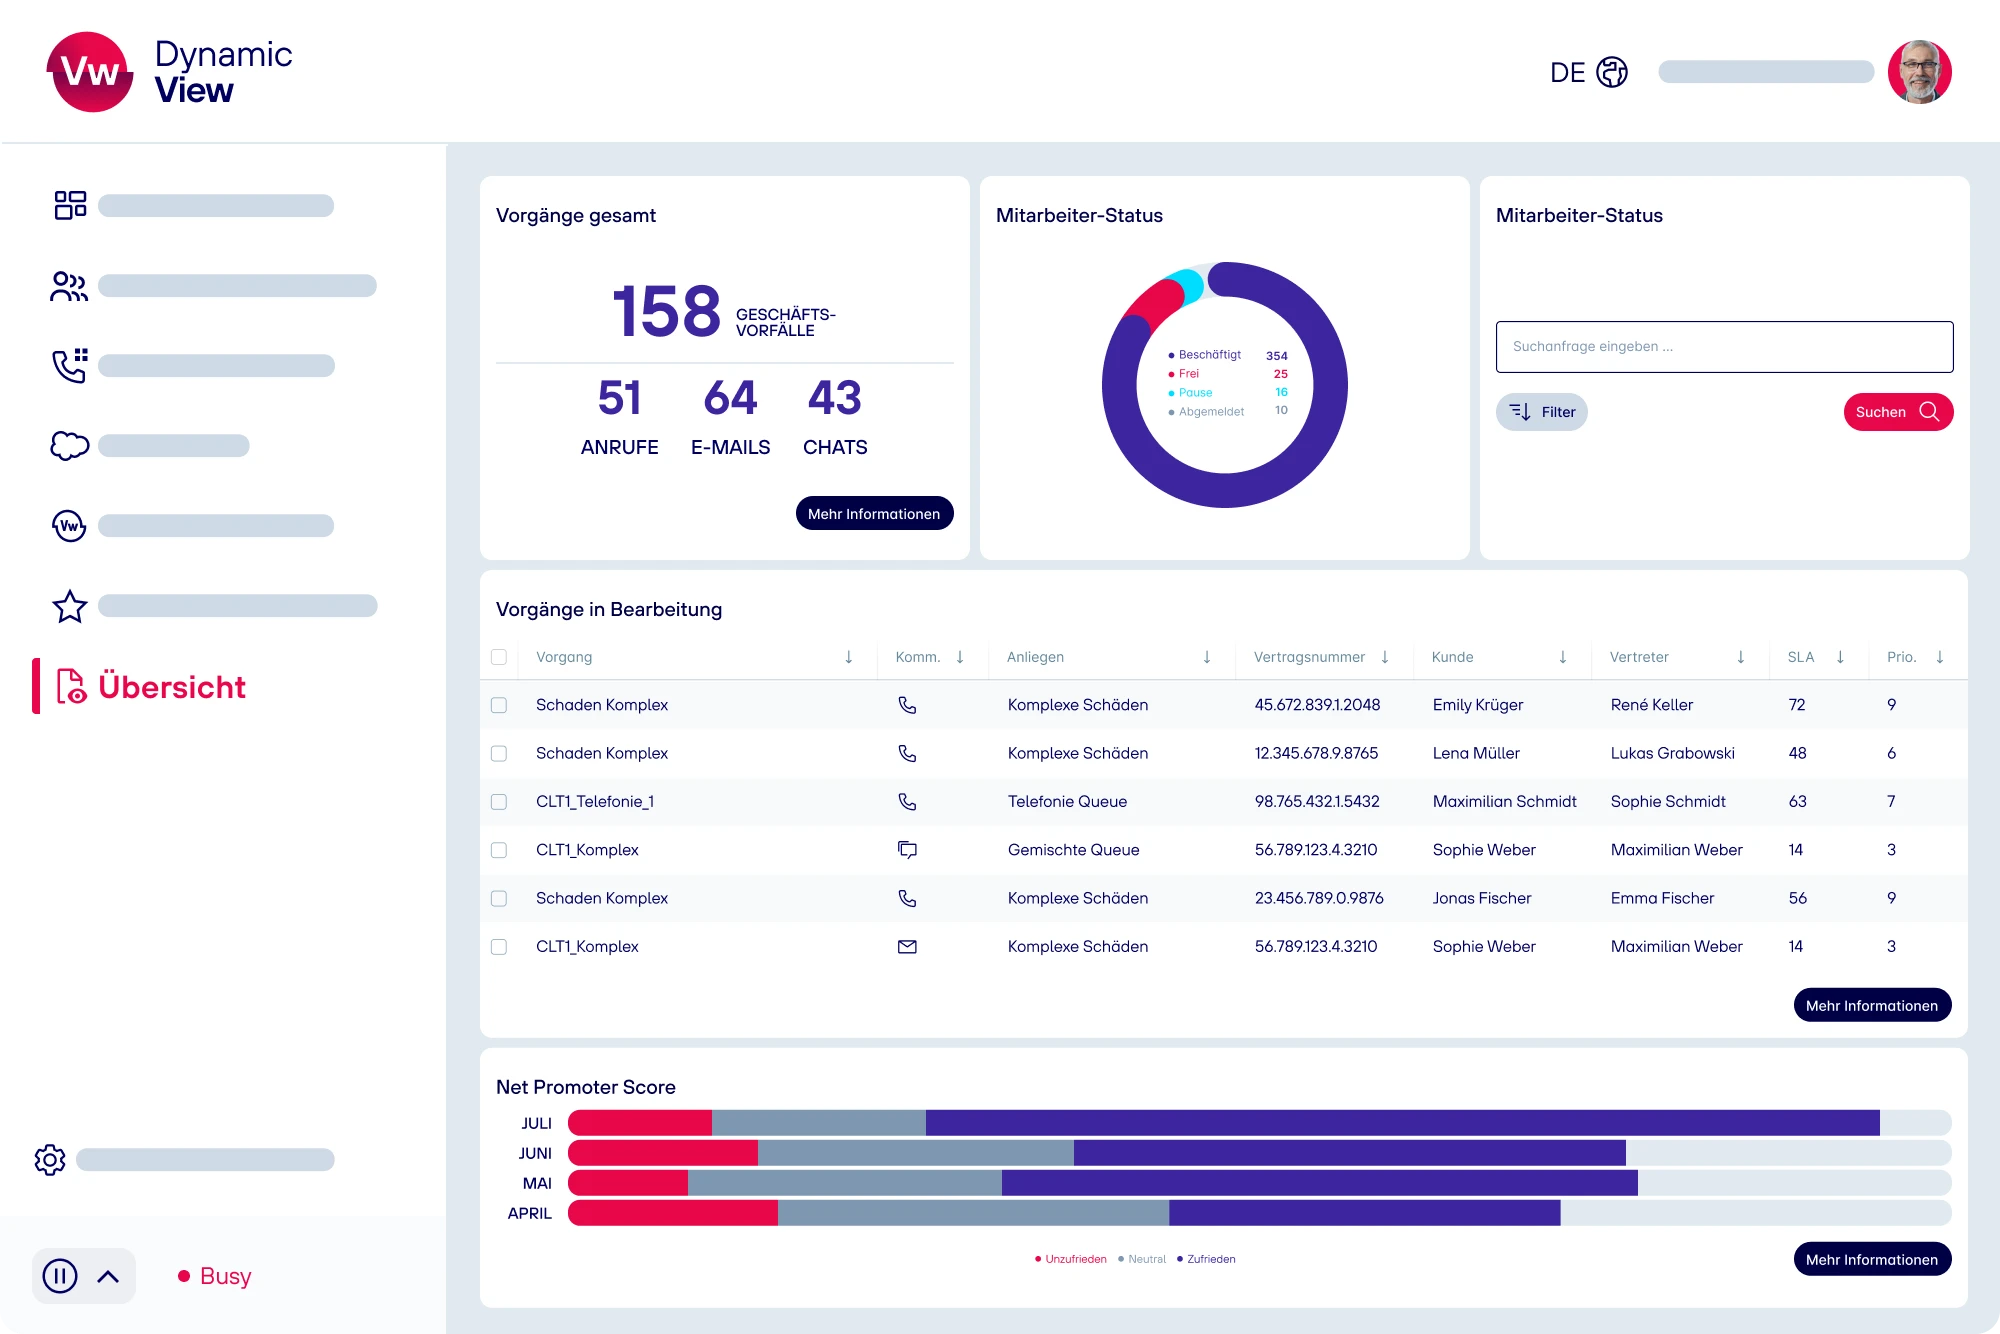
All Channels, One Dashboard, Complete Overview
Whether it's phone calls, chat, email, or traditional mail, Dynamic Workload brings all communication channels together in one central interface. This lets you see at a glance where action is needed and creates a transparent basis for excellent customer service.
Comprehensive data collection
All Information in One System
Dynamic Workload integrates seamlessly with existing CRM, ticketing, and collaboration tools such as Microsoft Teams. All relevant data is bundled across systems – for smooth processes and informed decisions from a central source.
Real-time insights
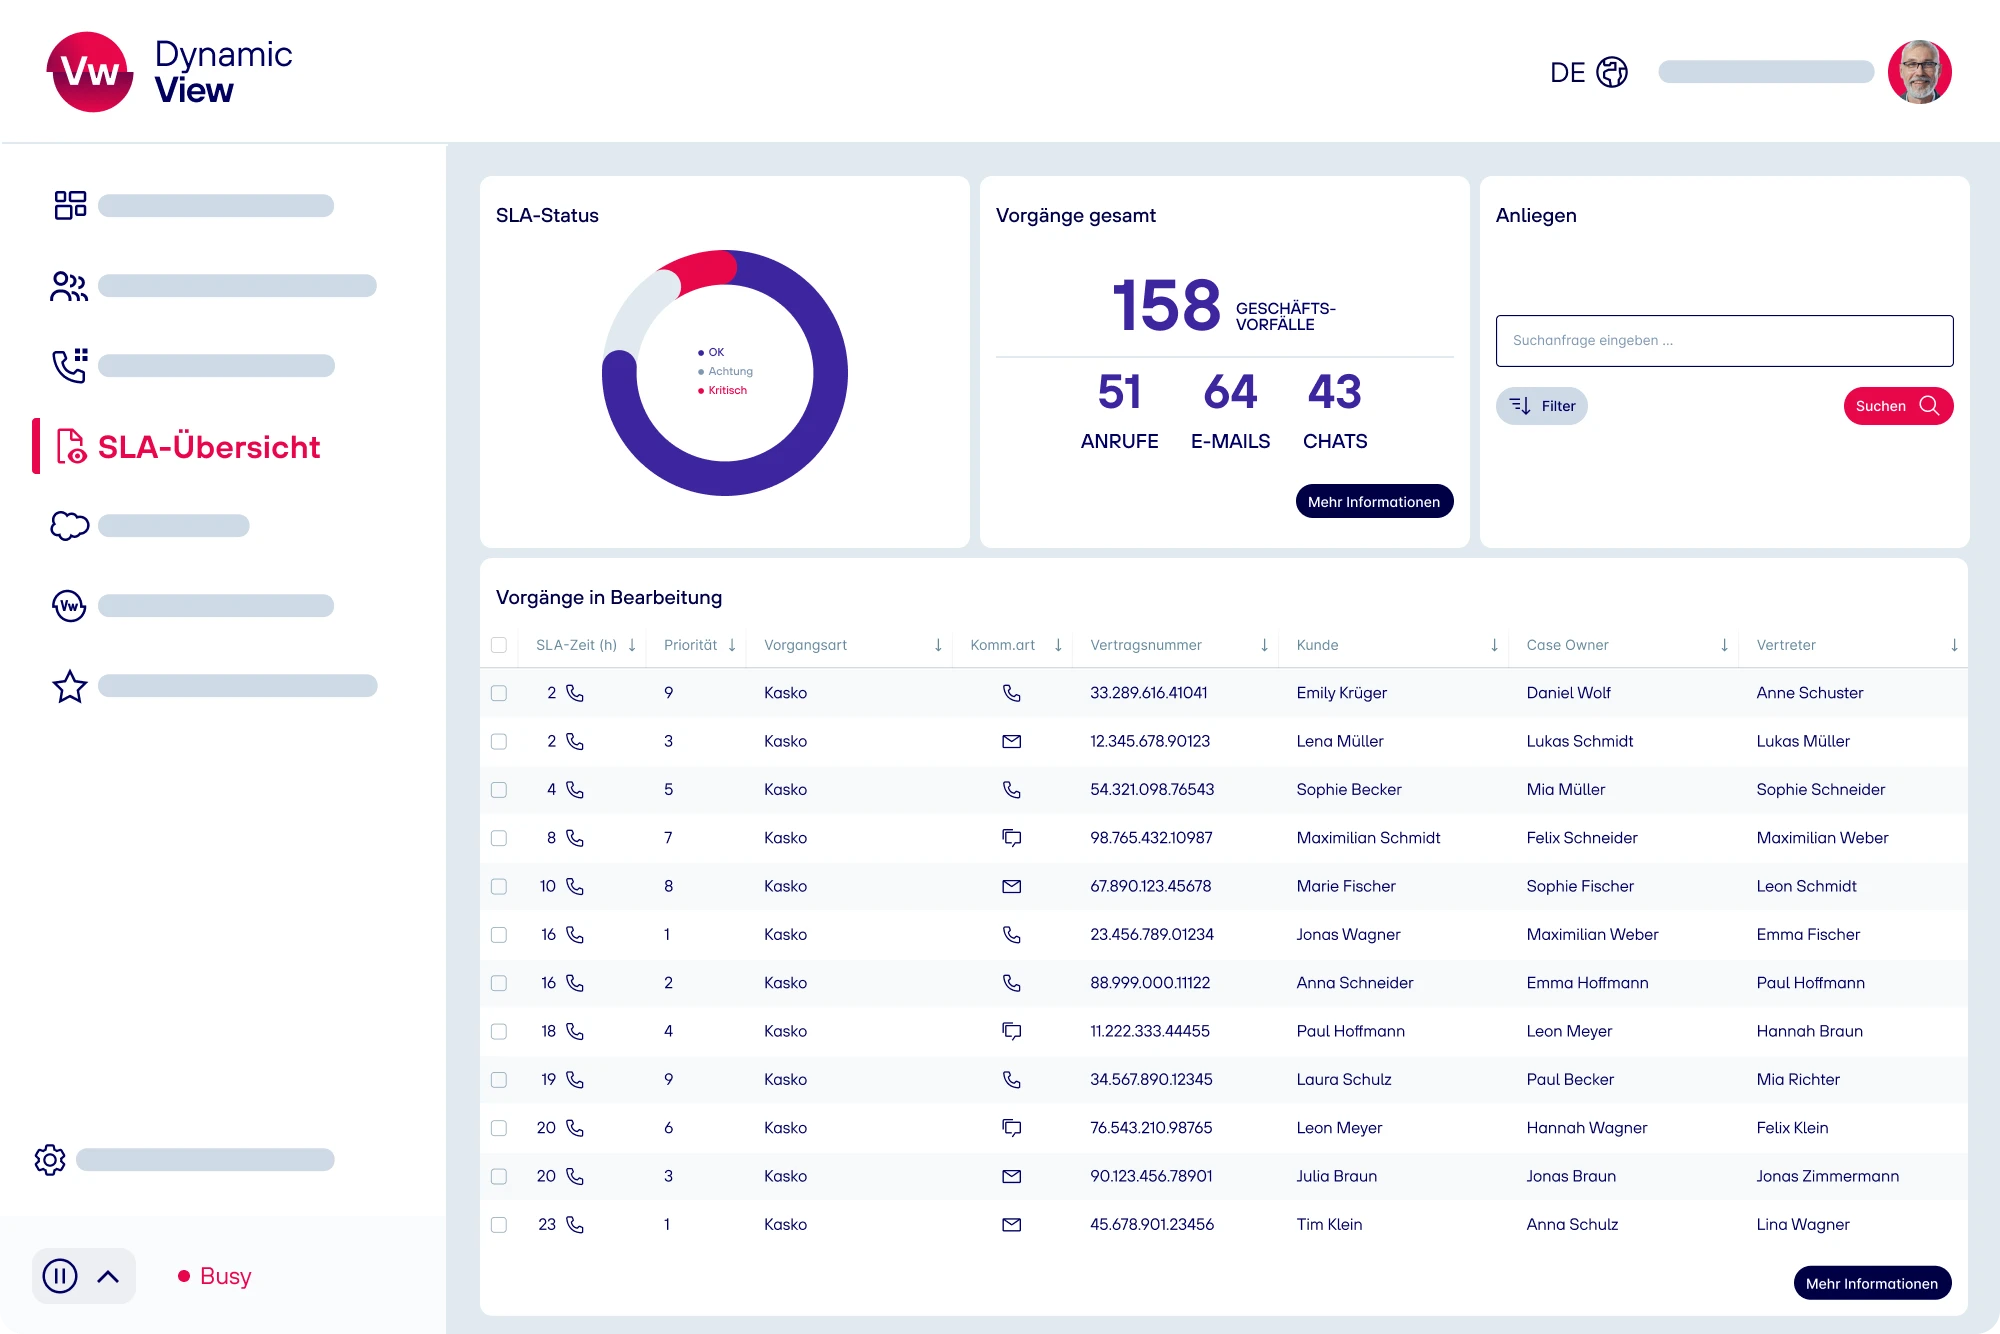
Transparent Insight into All Processes
Identify overloads, bottlenecks, or SLA risks in real time. In addition to the current live status, you have access to daily updated and historical data that can be intuitively recorded, analyzed, and compared. For informed decisions based on valid information.
Data protection compliant
100% Data Protection
Dynamic Workload meets the highest data protection standards and fulfills als requirements of works councils.
Location-independent
Comprehensive Overview from anywhere
Whether in the office, working from home, or on
the go: as a browser-based application,
Dynamic Workload is accessible anytime, anywhere. This way, you are always well informed.

Features at a Glance
Seamless Integration
Thanks to powerful API interfaces,
Dynamic Workload adapts flexibly to your existing
IT landscape.


Use Cases
Dynamic Workload Solutions


Dynamic Workload live
Discover how you can optimize your customer service with the help of
state-of-the-art technologies and request a no-obligation live demo!

FAQ
Frequently Asked Questions
Real-time monitoring helps identify SLA risks and overloads before they lead to backlogs or complaints. In service-intensive organizations, even a small delay can have noticeable effects on customer satisfaction, processing quality, and employee workload. Especially with fluctuating incoming volumes, seasonal peaks, or short-term outages, a live view of workloads is crucial. This enables managers to reallocate resources more effectively and make data-driven operational decisions.
A dashboard displays current data, whereas reporting evaluates developments, patterns, and causes over time. For operational management, a live dashboard is often sufficient, for instance, to view open tasks or team status. However, for capacity planning, process improvement, and management decisions, historical comparisons, trend analyses, and reliable key figures are essential.
Centralized monitoring becomes beneficial once customer inquiries are received through multiple channels and teams need to be managed cross-channel. Common triggers include growing backlogs, inexplicable SLA violations, or uneven workload distribution among teams. In many organizations, operational issues stem not from a lack of data, but from fragmented data sources. A centralized view reduces coordination efforts and makes priorities more quickly identifiable for leadership.
Insurance companies should structure their reporting not just by intake channels, but also by business processes, deadlines, and risk categories. A claim, a contract amendment, or a complaint each have different urgencies and regulatory requirements. Therefore, meaningful reports consider processing status, department, priority, escalation level, and SLA relevance. Furthermore, clean data quality is crucial. Unclear status values or manual shadow lists can quickly lead to incorrect management decisions.
Monitoring & Reporting improve service quality by making bottlenecks, backlogs, and quality risks visible early on. This enables managers to prioritize tasks, alleviate team workload, and manage critical processes promptly. Measurable effects often include shorter processing times, more stable service levels, reduced backlogs, and improved predictability.